Powering Revenue Growth for 2,500+ Restaurants

Real Revenue
Results.

See how restaurants increase direct sales, capture more guest data, and reduce third-party dependency with Dishio.

Real operators.

Real numbers.

Before and after.

Years in Restaurant Growth.

Single-Location to Multi-Location Operators.

From $4.5M to a $5.4M Baseline: How Carnegie Built a Multi-Location Growth Engine

+$896,224
Year-over-year expansion across all locations.
$5,402,491
Established Annual Revenue Baseline
8.83%
Average Monthly YoY Growth Rate

Carnegie Diner & Café

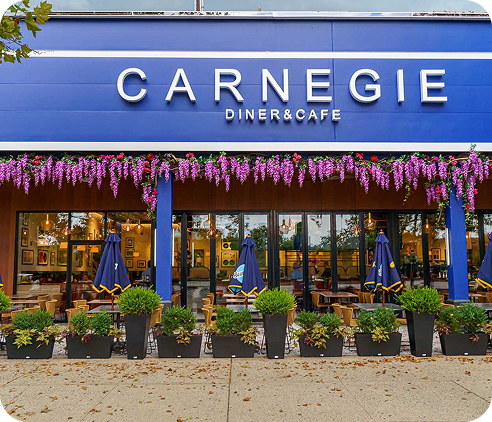
Multi-Location Diner & Café (NY, NJ, VA)

How Burger King Collected 29K Emails and Added $85K in Sales, All With $0 Ad Spend

29,000+
Owned Guest Contacts (90 Days)
+$85,000
Tracked Direct Revenue — Zero Ad Spend
25%+
Promotion Redemption Rate

Burger King Costa Rica

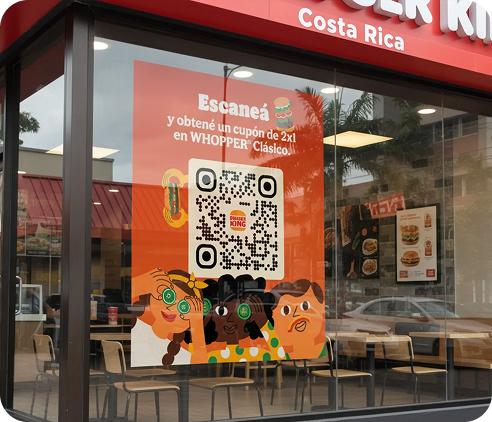
Quick Service Restaurant — Nationwide Franchise

How Ditto’s Grill Built a 10,000+ Guest Database to Drive Predictable Growth in 2026

10,000+
Owned Guest Contacts
+$22,027
YoY Revenue Turnaround (30 Days)
13%
YoY Growth — One Month After Launch

Ditto’s Grill

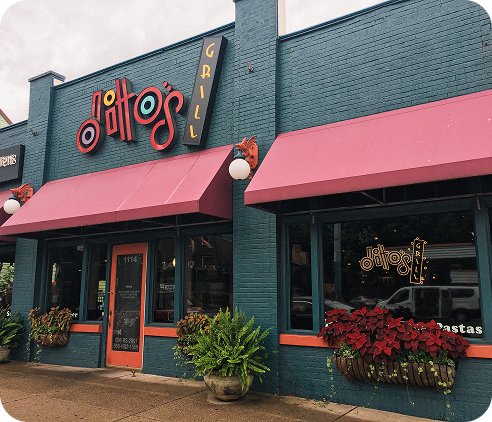
American Grill & Bar — Louisville, KY

Most Restaurants Are Leaving
Revenue on the Table.

The difference between growing restaurants and stagnant ones is simple: they know who their guests are and how to bring them back.

Now Let’s Look at
Your Numbers.

You’ve seen what’s possible. In a free growth evaluation, we’ll review your traffic, third-party reliance, guest capture, and repeat visit strategy — and show you where revenue is being lost and how to recover it.